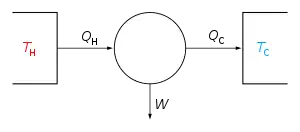
نمودار فشار حجم
نمودار فشار-حجم(به انگلیسی: Pressure volume diagram) که با نام نمودار P-V نیز شناخته می شود، یک نمودار ترمودینامیکی است که برای توصیف تغییرات حجم و فشار در یک سیستم ترمودینامیکی یا یک چرخه ترمودینامیکی کاربرد دارد.این نمودار در قرن 18 میلادی وب برای توصیف موتورهای بخار رشد و گسترش یافت.
| ترمودینامیک |
|---|
 |
|
نگارخانه
منابع
- Cardwell, D. S. L. (1971). From Watt to Clausius: The Rise of Thermodynamics in the Early Industrial Age. Heinemann: London. pp. 79–81. ISBN 0-435-54150-1.
- Miller, D. P. (2011). "The Mysterious Case of James Watt's '"1785" Steam Indicator': Forgery or Folklore in the History of an Instrument?". International Journal for the History of Engineering & Technology. 81: 129–150. doi:10.1179/175812110X12869022260231
- Pacey, A. J. & Fisher, S. J. (1967) "Daniel Bernoulli and the vis viva of compressed air", The British Journal for the History of Science 3 (4), p. 388–392, doi:10.1017/S0007087400002934
- British Transport Commission (۱۹۵۷) Handbook for Railway Steam Locomotive Enginemen، London : B.T.C.، p. ۸۱، (facsimilie copy publ. Ian Allan (۱۹۷۷)، ISBN 0-7110-0628-8)
This article is issued from Wikipedia. The text is licensed under Creative Commons - Attribution - Sharealike. Additional terms may apply for the media files.

.svg.png.webp)